Five Things We've Learned from NAEP Grade 12 Mathematics and Reading Results

Did you miss the release of our NAEP 2013 mathematics and reading results for twelfth-graders? Here’s a quick recap of five important things we’ve learned.
-
Scores are relatively flat since 2009 nationally.
Our data show that twelfth-graders, on average, have made no progress in mathematics and reading from the last assessment in 2009. Additionally, the percentages of students reaching NAEP’s
Proficient achievement level have remained stable: 38% in reading and 26% in mathematics.
This doesn’t mean there was no improvement at all. In fact, when you dig deeper, you find a few interesting results that shouldn’t be overlooked.
-
Four of the eleven volunteer states made gains in mathematics and/or reading since 2009.
In 2009, 11 states volunteered to participate in the NAEP grade 12 assessments. Four of them made gains in 2013—Arkansas, Connecticut, Idaho, and West Virginia made gains in mathematics, and Arkansas and Connecticut also showed improvements in reading. While NAEP cannot pinpoint why these states made gains, the results should encourage us to ask, “What’s working for their students?” We can continue to learn and improve together.
-
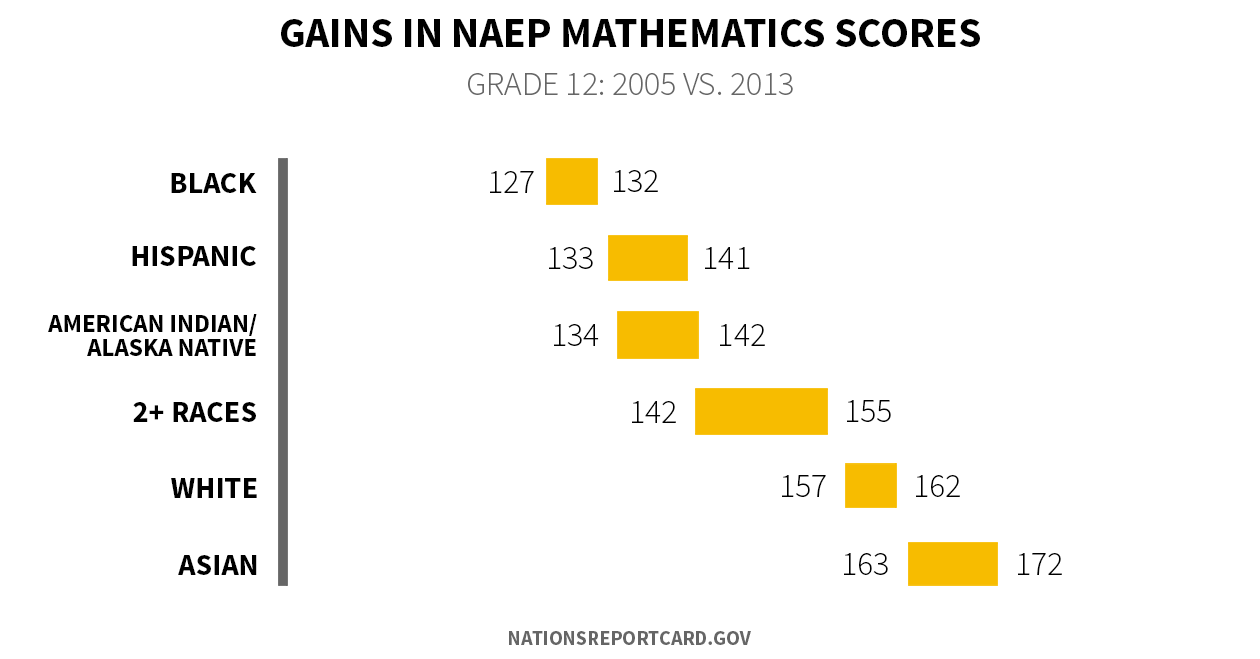
Students of almost all races and ethnicities have made gains in mathematics and reading since 2005, although no group has made progress since 2009.
When we break out the results for students of different races and ethnicities, we find that White, Black, Hispanic, and Asian/Pacific Islander twelfth- graders have improved on average in one or both subjects since 2005.
Their levels of performance, however, have stalled over the last four years. At the same time, achievement gaps between historically higher and lower performing student groups are wide and have not budged.
In order to meet the educational needs of all our students, we as a nation must continue to work hard. In order to see the end of achievement gaps, our efforts toward lower performing student groups have to be even greater.

-
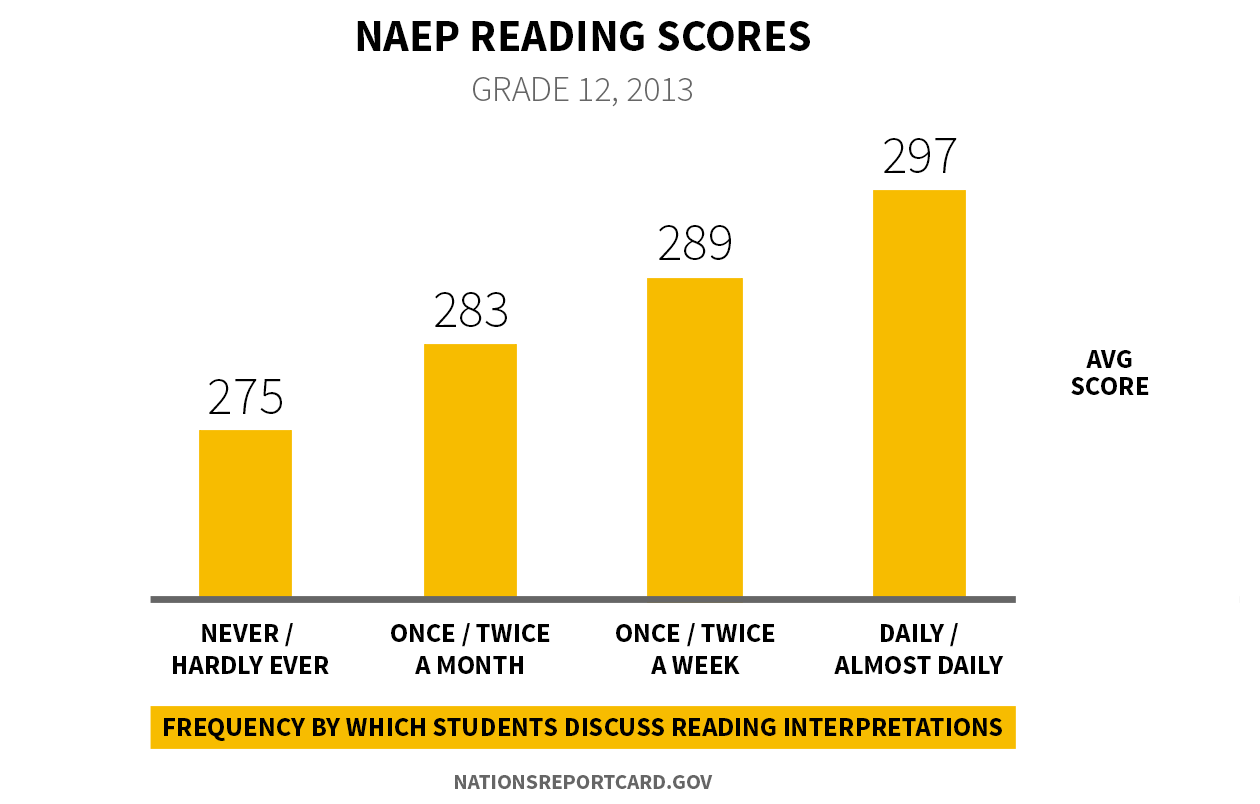
Students Who Discussed Interpretations of Reading in Class Performed Better
NAEP’s student, teacher, and school questionnaires provide interesting insights into what students do in class and how these factors relate to student performance. Results for twelfth-graders showed a positive relationship, for example, between students who are engaged and asked to think about the texts they read and how they perform. Sue Pimentel noted in the presentation at the Grade 12 release event, “The data suggest the daily practice of asking twelfth-graders to write and talk about everything they read matters. It matters a lot."

-
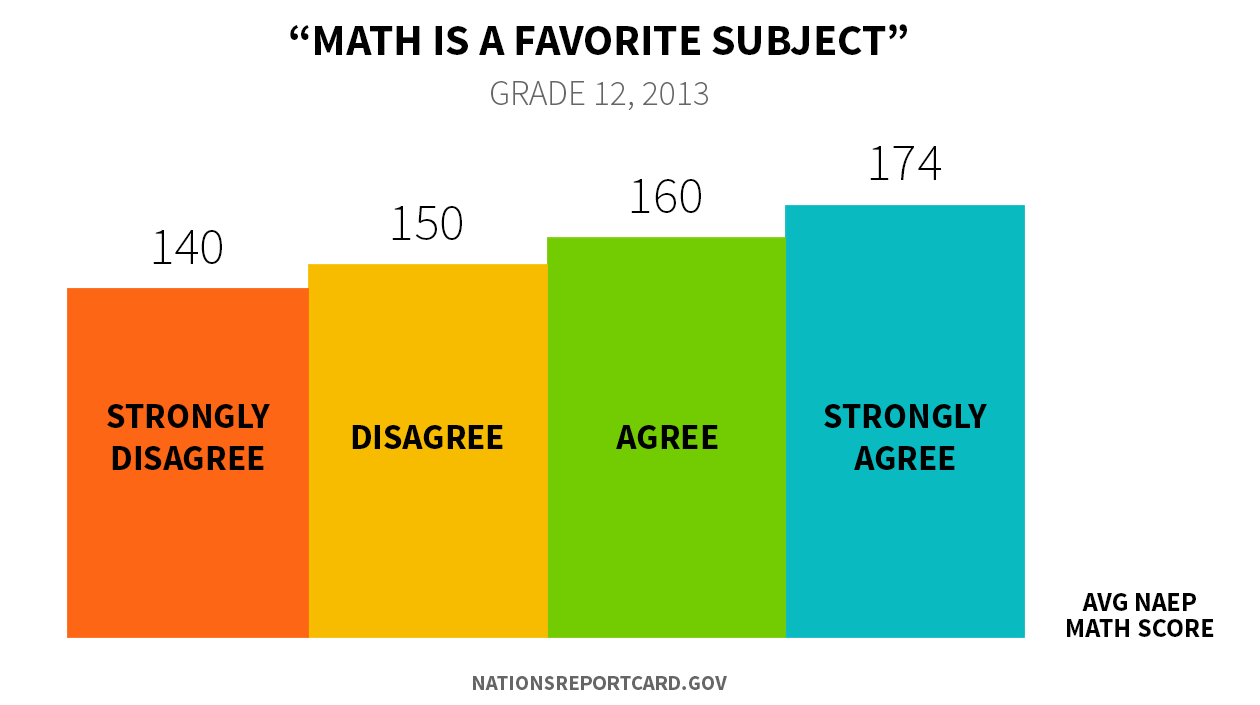
Students Who Enjoy Mathematics Tend to Perform Better
This may seem like a no-brainer, but students who responded positively to the statement, “Mathematics is a favorite subject,” tended to perform better on NAEP. Our data, however, point out that over half of the students disagreed with the statement. An interesting question for discussion is, “How important is it for students to enjoy mathematics?”

These were only five major findings from the grade 12 data, but we invite you to take a look at our
interactive report card to discover more. What interesting findings have you uncovered?
May 15, 2014
Share This Post:
