NAEP in the National Conversation: Black Male Achievement
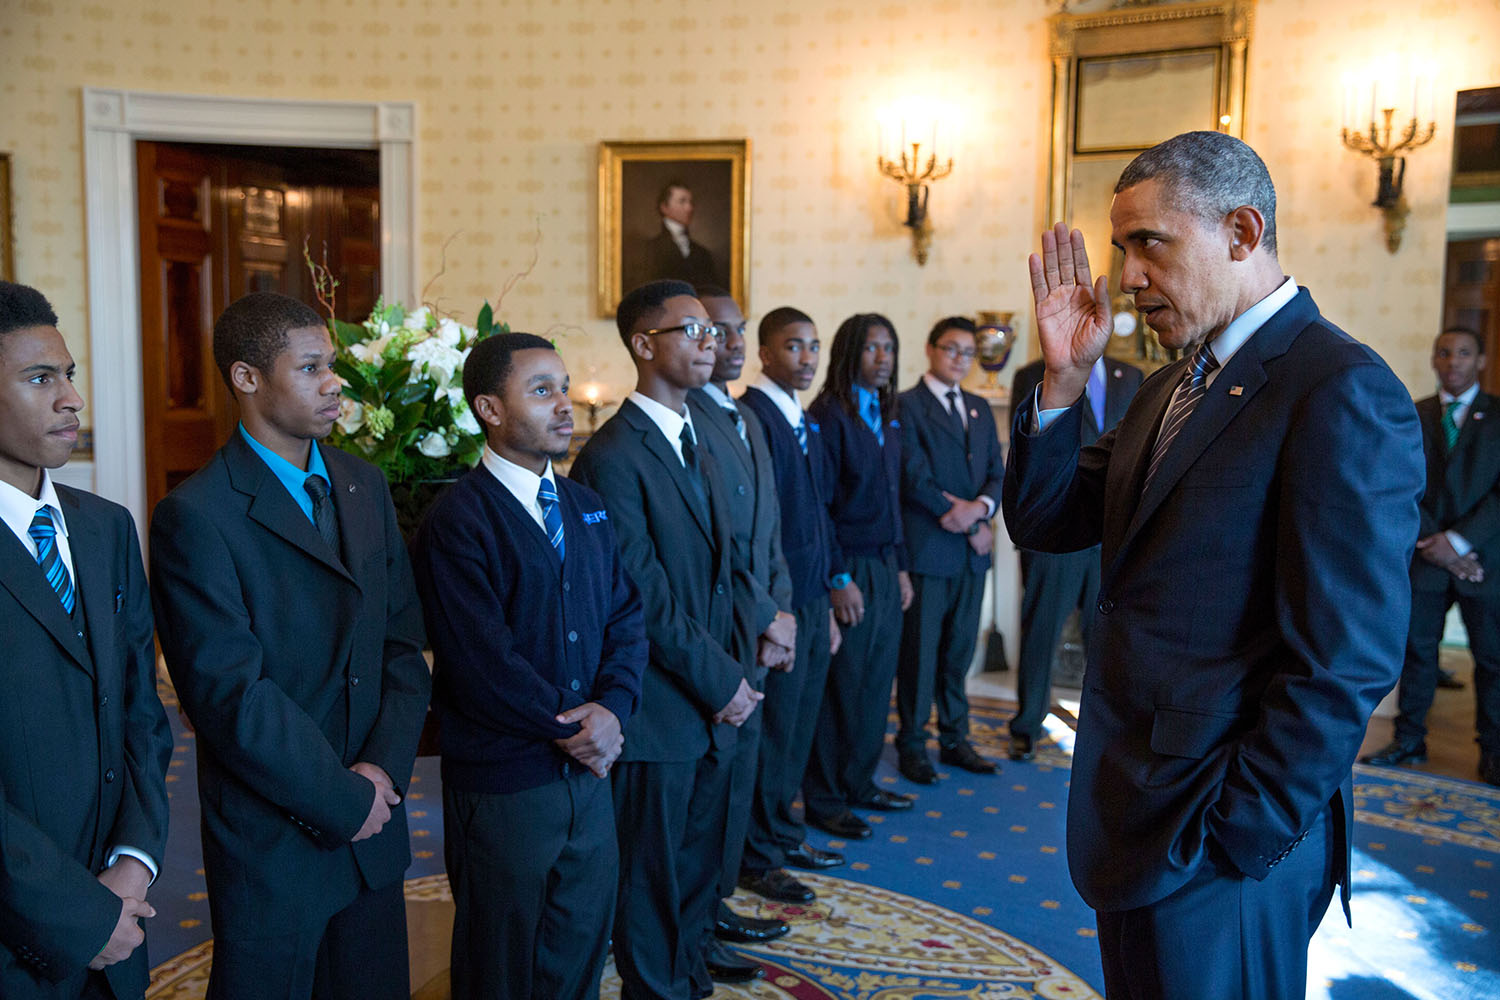
NAEP has been a valuable resource for understanding the condition of education in America since its first assessment in 1969. When President Obama launched the “My Brother’s Keeper” initiative in late February, 2014, NAEP data were at the center of the conversation. In a blog post announcing the initiative, the White House used NAEP data to call attention to the lagging achievement of boys and young men of color:
“As recently as 2013, only 14 percent of black boys and 18 percent of Hispanic boys scored proficient or above on the 4th grade reading component of the National Assessment of Educational Progress compared to 42 percent of white boys and 21 percent of black and Hispanic girls.”
Having tracked such gaps in achievement for most of its history, NAEP is vital not only in documenting academic disparities but also in shedding light on these gaps. For example, the President cites economic insecurity as one major issue affecting boys and young men of color disproportionately.
Using NAEP data we can begin to understand how socioeconomic status (SES) and academic achievement are related. NAEP collects information about students’ eligibility for the
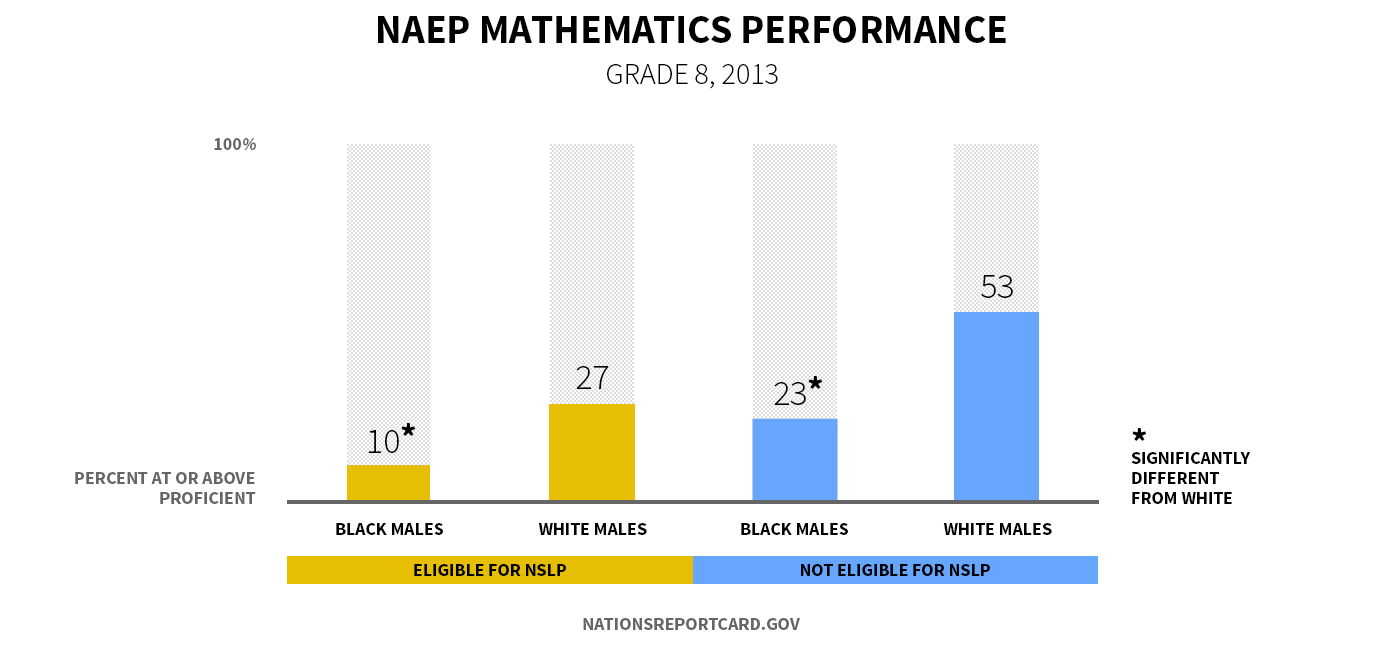
National School Lunch Program (NSLP), which categorizes students by family income levels: students eligible for free and reduced-priced lunch come from families with lower incomes than students who are not eligible. NAEP shows that eligible students, on average, score lower than students who are not eligible. The pattern is true for Black and White male students in eighth-grade mathematics.
But it’s worth noting that even with the same NSLP status, Black male achievement trails that of White males. In grade 8 mathematics, 10 percent of Black male students who were eligible for NSLP scored at or above Proficient in mathematics, compared to 27 percent of eligible White male students.
While these data present evidence of achievement gaps persisting when one measure of SES is constant, they do not speak to how varying degrees of SES between Black and White students exacerbate the achievement gap. According to the U.S. Census Bureau, approximately 28 percent of the Black population had incomes below the poverty level, compared to only 11 percent of the White population. Students from both groups would be classified as eligible for NSLP, but the NAEP results for Black, NSLP-eligible students is derived from a larger share of severely impoverished students than the White, NSLP-eligible student results.
This fall NCES will release a new report that closely examines the performance of Black male students on NAEP. The report will present additional details on how achievement gaps and performance have changed over time in mathematics and reading, providing more context for the ongoing national conversation surrounding this issue.
While NAEP results won’t provide a solution to closing the achievement gap, they can inform policymakers and educators as they work to improve the education of our nation’s young Black males.
To explore more results, visit The Nation’s Report Card website, where student results are available for the nation, all 50 states, and 21 urban school districts. You can also dig even deeper by using the NAEP Data Explorer to compare student achievement across several different variables.
JULY 23, 2014