Pre-Coronavirus, Big Gains for Large Cities and Urban Districts on NAEP Since the Early 2000s

Since the early 2000s, the NAEP program has partnered with some of the largest urban districts in the nation to administer a district-level NAEP assessment, or the Trial Urban District Assessment (TUDA). The most recent results from 2019 predate the schooling disruptions caused by the coronavirus pandemic. While it may be too soon to say how current learning disruptions will affect achievement—particularly for students in urban settings—we can review progress they have made since the early 2000’s. All results discussed were produced by the online data analysis tool, the
NAEP Data Explorer (NDE).
More Gains Overall in Large Cities Than for the Nation
Over the period from the early 2000s to 2019, schools in
large cities made significantly greater gains in grades 4 and 8 mathematics and reading than the nation overall. While the nation had 5- to 6-point gains in grades 4 and 8 mathematics, large city schools raised their average scores by 11- to 12- points. In reading, the nation saw 2-point gains in grades 4 and 8 while large cities made gains as large as 10-points. These gains in large cities have reduced score differences with the nation by half or close to half (see figure 1).
Figure 1
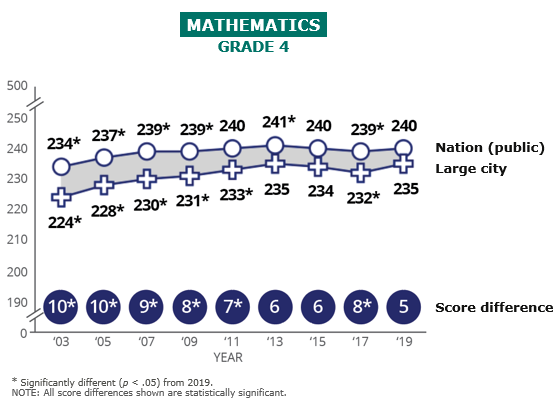
The nation’s standard deviation ranged from 28 to 32 between 2003 and 2019. (Or we could use the average = 30.)
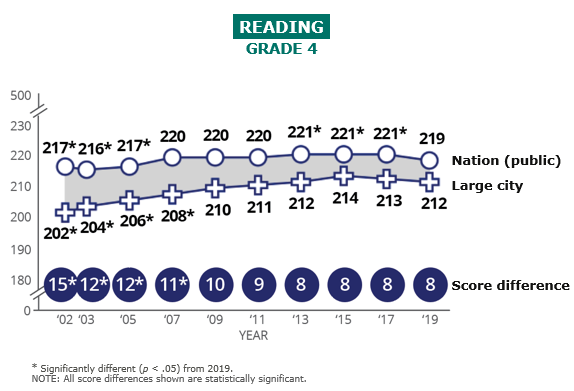
The nation’s standard deviation ranged from 35 to 39 between 2002 and 2019. (Or we could use the average = 37.)
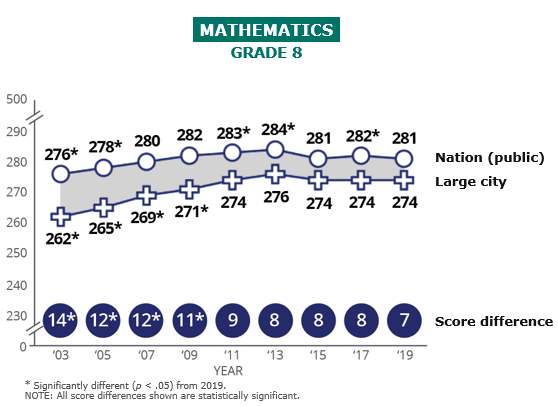
The nation’s standard deviation ranged from 36 to 40 between 2003 and 2019. (Or we could use the average = 37.)
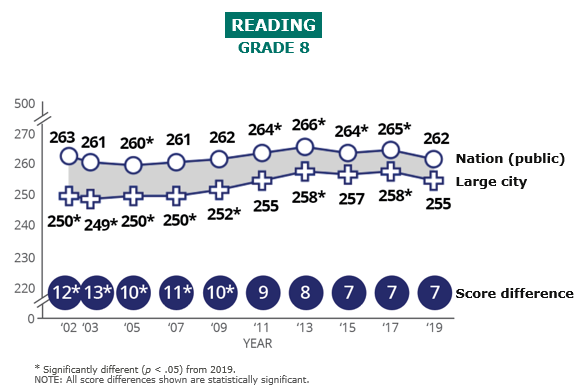
The nation’s standard deviation ranged from 34 to 38 between 2002 and 2019. (Or we could use the average = 35.)
Most TUDAs Made Larger Gains Than the Nation
Across mathematics and reading at grades 4 and 8, most districts with TUDA data reaching back to the early 2000s1 had score gains that were significantly larger than the nation’s gains (see figure 2). These districts are:2
- Atlanta made gains of 16 points in mathematics grade 4, 24 points in mathematics grade 8, 18 points in reading 4, and 19 points in reading 8;
- District of Columbia (DCPS) made gains of 30 points in mathematics grade 4, 26 points in mathematics grade 8, 24 points in reading 4, and 11 points in reading 8;
- Chicago made gains of 18 points in mathematics grade 4, 21 points in mathematics grade 8, and 15 points in reading 4;
- Los Angeles made gains of 16 points in mathematics grade 8, 14 points in reading 4, and 11 points in reading 8;
- Boston made gains of 14 points in mathematics grade 4 and 17 points in mathematics grade 8;
- San Diego made gains of 14 points in mathematics grade 4 and 18 points in mathematics grade 8;
- Charlotte made gains of 9 points in mathematics grade 8; and
- Houston made gains of 10 points in mathematics grade 8.
1 The first TUDA
mathematics assessment was administered in 2003, and ten districts participated in the assessment in 2003: Atlanta, Boston, Charlotte, Chicago, Cleveland, DCPS, Houston, Los Angeles, New York City, and San Diego. The first TUDA reading assessment was administered in 2002, and five districts participated in the assessment in 2002: Atlanta, Chicago, DCPS, Houston, and Los Angeles.
2 The ordering of the TUDAs is based on the number of score gains significantly larger than the national public’s across the four subjects/grades (in descending order). For TUDAs with the same number of score gains across the subjects/grades, alphabetic order is used.
Figure 2
Mathematics 4
2003-2019
Score Change | Mathematics 8
2003-2019
Score Change | Reading 4
2002-2019
Score Change | Reading 8
2002-2019
Score Change |
|---|
| Jurisdiction | Score
Change | Jurisdiction | Score
Change | Jurisdiction | Score
Change | Jurisdiction | Score
Change |
|---|
| ↑ 2019 score is significantly higher (p < .05) than 2003/2002 score. |
| ↔ 2019 score is not significantly different from 2003/2002 score. |
| ↓ 2019 score is significantly lower (p < .05) than 2003/2002 score. |
# Rounds to zero.
* Average score change for the district or large city is significantly different (p < .05) than the average score change for National Public. |
| DCPS | ↑30* | DCPS | ↑26* | DCPS | ↑24* | Atlanta | ↑19* |
|---|
| Chicago | ↑18* | Atlanta | ↑24* | Atlanta | ↑18* | Los Angeles | ↑11* |
|---|
| Atlanta | ↑16* | Chicago | ↑21* | Chicago | ↑15* | DCPS | ↑11* |
|---|
| San Diego | ↑14* | San Diego | ↑18* | Los Angeles | ↑14* | Large City | ↑4* |
|---|
| Boston | ↑14* | Boston | ↑17* | Large City | ↑10* | Chicago | ↔4 |
|---|
| Large City | ↑11* | Los Angeles | ↑16* | New York City | ↔6 | Houston | ↔1 |
|---|
| Houston | ↑8 | Large City | ↑12* | National Public | ↑3 | National Public | ↔-1 |
|---|
| Los Angeles | ↑8 | Houston | ↑10* | Houston | ↔-2 |
|---|
| National Public | ↑6 | Charlotte | ↑9* |
|---|
| New York City | ↑4 | New York City | ↑7 |
|---|
| Charlotte | ↑4 | National Public | ↑5 |
|---|
| Cleveland | ↔3 | Cleveland | ↔#* |
|---|
Summary
While students across the nation continued to outscore students in large cities in NAEP reading and mathematics as of 2019, students in large cities overall and several TUDA districts have made exceptional progress since the early 2000s in closing the achievement gap with the nation. Gains made by students in large cities have been greater than the gains seen throughout the nation as a whole. Most of the TUDA districts that were a part of the first administrations in the early 2000’s scored significantly higher than the nation over this same time period, with Atlanta and DCPS having scoring gains that were significantly higher than the nation in all four subject-grade combinations.
While we anticipate school disruptions related to the pandemic may influence the next rounds of NAEP results for urban schools, we cannot speculate how that may affect the long-term improvement we’ve observed in students in large city districts. As more data become available, NCES will continue to analyze and report on how NAEP data can be a tool in understanding how our 4th and 8th graders around the country are learning.
Share This Post:

