In Case You Missed It - Top Blog Posts, Tweets, and Data Analyses from NAEP
With all that 2020 brought us, we also experienced a deluge of data and information. Such overwhelming amounts of news made it easy to miss opportunities to learn about and engage with important education data. In this post, we recap some top moments in 2020 from the National Assessment of Educational Progress (NAEP).
Are U.S. students prepared to learn online when schools need to be closed?
 This blog post explores the availability of digital tools for students by school type, locale, jurisdiction, and socioeconomic status. While most students had access to a desktop computer or tablet and internet at home, 2019 NAEP mathematics data suggest that some communities lack access to and experience with digital devices for learning.
An early look at how 2018-19 state proficiency standards map onto NAEP scales.
 Do you know how your state’s proficiency standards align with NAEP achievement levels? This post shows preliminary results of states’ 2018-19 proficiency standards in reference to NAEP’s achievement levels. In grades 4 and 8 mathematics and reading, half or more of states that participated in the analysis had proficiency standards in the NAEP Basic range.
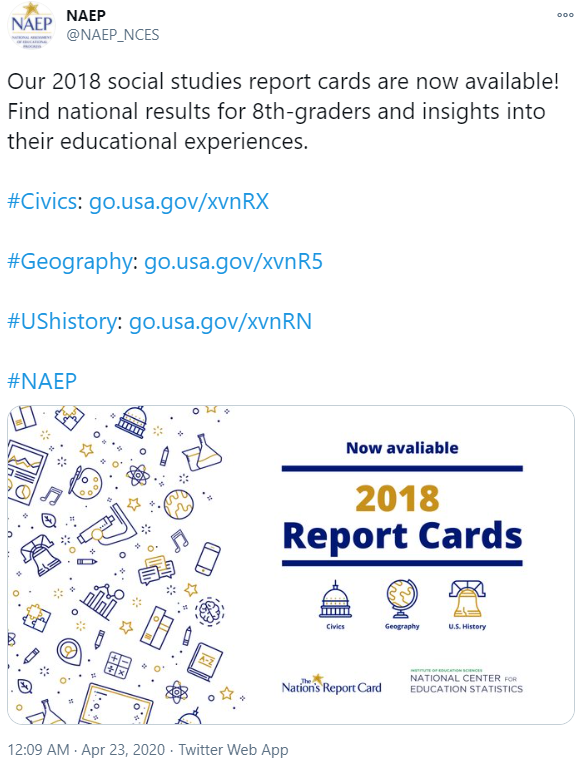
Follow us on
Twitter to stay up to date on all things NAEP.
NAEP Data Tools
Did you contribute to one of the 103,000 views of the
nationsreportcard.gov? If not, here’s your chance! While you’re there, visit some of our most popular data tools.
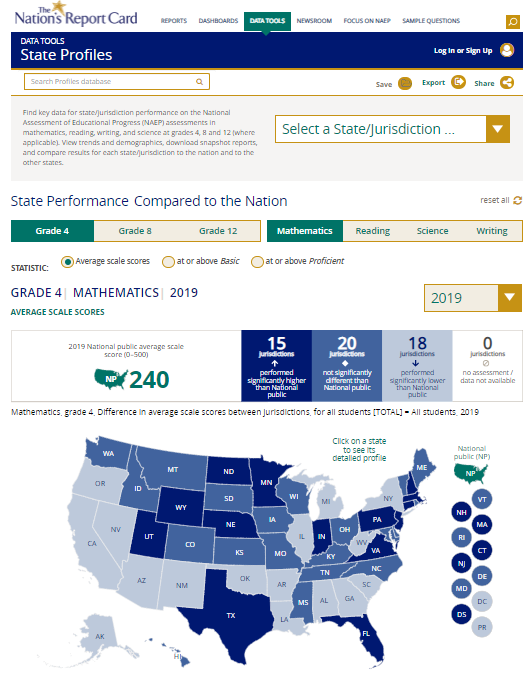
State Profiles
Find your state to see how it performed on 2019 NAEP mathematics and reading. (51k views)
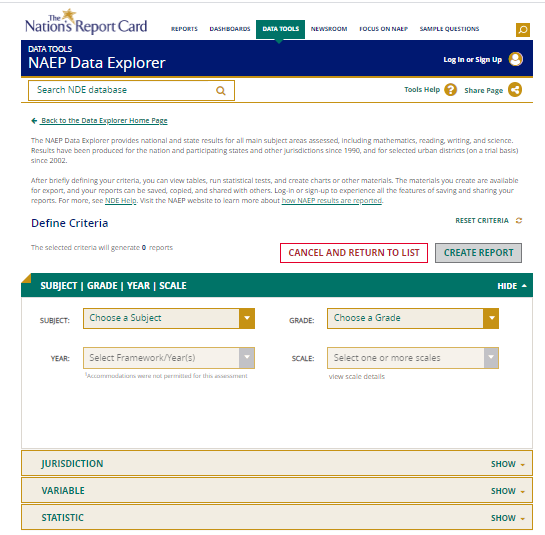
NAEP Data Explorer
Explore NAEP results across hundreds of factors. Some of the most popular queries were student race/ethnicity, absenteeism, and computer and internet access. (25k views; ~4k uses daily)
NAEP Reports
If you want to know how fourth-, eighth-, and twelfth-graders performed in mathematics and reading, check out our Nation’s Report Card highlights pages. They summarize changes in student performance as well as contextual results—like how many students are in schools with inadequate instructional materials and supplies. You can also dig into the Report Cards themselves.
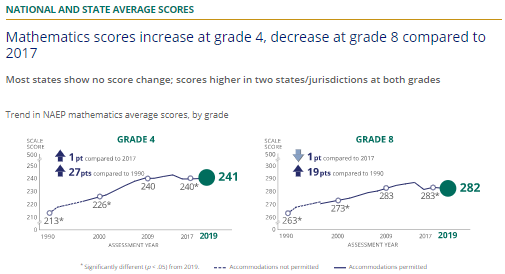
Mathematics
Grade 4 and 8
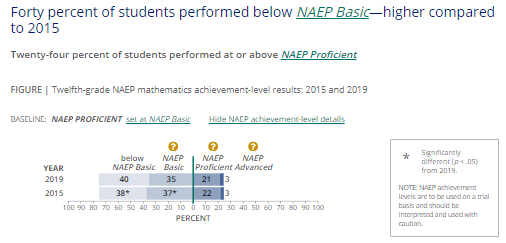
Grade 12
These and many other resources are available at
nationsreportcard.gov. Be sure to visit during 2021 for more information about our nation’s students.
Share This Post:

