For more than a decade, the National Center for Education Statistics has been mapping state standards to the National Assessment of Educational Progress (NAEP) in reading and mathematics in grades 4 and 8. This process of “state mapping” shows where each state’s standards lie on the NAEP scale.
NCES has released the latest version of the state mapping report. Here are answers to three commonly asked questions about the report.
What are the main purposes of the mapping study?
The mapping study is designed to provide a common metric for comparing states’ standards for proficiency in reading and mathematics in grades 4 and 8. This allows states to see how their proficiency standards compare with the standards in other states, as well as the NAEP standard for proficiency. It also allows states to track changes in their state standards relative to NAEP and other states.
Why is NAEP used as the basis for comparison of state proficiency standards?
Each state administers its own assessment and sets its own standards for fourth- and eighth-grade reading and mathematics proficiency. Because states use different standards for “proficiency,” state standards cannot be compared directly; they need to be placed on a common metric. NAEP provides the common metric.
How are the states compared?
States’ standards are compared using the “NAEP scale equivalent score” corresponding to a state’s standard. The “NAEP scale equivalent score” is the point on the NAEP scale equivalent to the proficiency cut off point on a state’s assessment. NAEP scale equivalent scores are calculated separately for each state at each grade level (grades 4 and 8) in each subject (reading and mathematics).
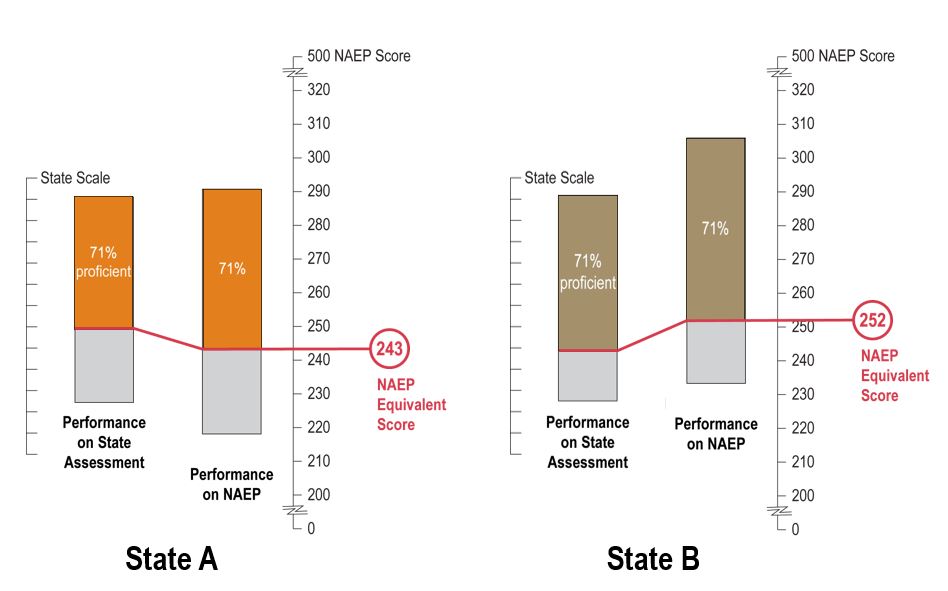
Here is an example of how “mapping” works (see the figure below). In state A, 71 percent of students scored at or above the Proficiency cut point on its state assessment in a given subject and grade. If we look at the NAEP scale, we find that 71 percent of students in state A scored at or above 243 on NAEP in the same subject and grade. So, we say that 243 is the NAEP scale equivalent score for state A in the given subject and grade. The same process is done for state B, in which 71 percent of its students also scored at or above Proficient on its state exam. Seventy one percent of students in state B scored at or above 252 on NAEP, making this the NAEP equivalent score.