- Surveys & Programs
- Data & Tools
- Fast Facts
- News & Events
- Publications & Products
- About Us
The Nation's Report Card: Civics 2010
May 2011
Author: National Center for Education Statistics
![]() Download The Nation's Report Card: Civics 2010 PDF for viewing and printing (6246K PDF)
Download The Nation's Report Card: Civics 2010 PDF for viewing and printing (6246K PDF)

Executive Summary
Students making progress in civics at grade 4 but not at grades 8 and 12
What are students studying in civics?
Percentages of fourth-graders at or above Basic and Proficient levels increase
No significant changes in percentages of students at Advanced
Examples of skills demonstrated by students performing at each achievement level
Hispanic students make gains from 1998 to 2010 at all three grades
Performance improves from 1998 to 2010 for most racial/ethnic groups at grade 4
Female students score higher than male students at grade 4
Nationally representative samples of about 7,100 fourth-graders, 9,600 eighth-graders, and 9,900 twelfth-graders participated in the 2010 National Assessment of Educational Progress (NAEP) in civics. At each grade, students responded to questions designed to measure the civics knowledge and skills that are critical to the responsibilities of citizenship in America’s constitutional democracy. Comparing the results from the 2010 assessment to results from two previous assessment years shows how students’ knowledge and skills in civics have progressed over time.
Students making progress in civics at grade 4 but not at grades 8 and 12
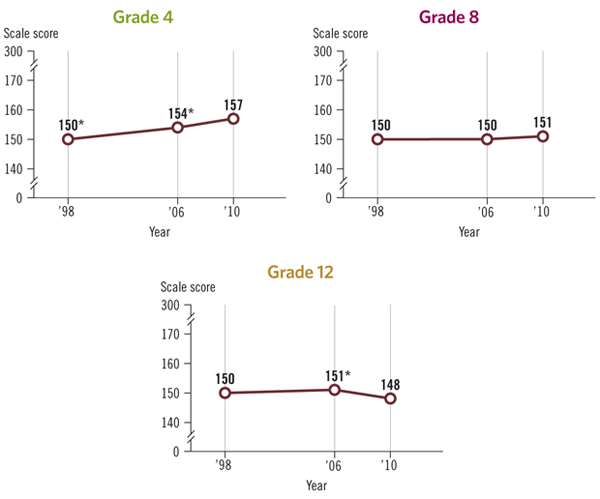
In comparison to earlier civics assessments in 1998 and 2006, the average score in 2010 was
- higher than the scores in both years at grade 4,
- not significantly different from the score in either year at grade 8, and
- lower than the score in 2006 but not significantly different from the score in 1998 at grade 12.
Trend in fourth-, eighth-, and twelfth-grade NAEP civics average scores

* Significantly different (p < .05) from 2010.
SOURCE: U.S. Department of Education, Institute of Education Sciences, National Center for Education Statistics, National Assessment of Educational Progress (NAEP), 1998, 2006, and 2010 Civics Assessments.
What are students studying in civics?88% of fourth-graders had teachers who reported emphasizing politics and government to a small extent or more in social studies classes in 2010. 78% of eighth-graders reported studying about Congress in 2010. 67% of twelfth-graders reported studying about the U.S. Constitution in 2010. |
Percentages of fourth-graders at or above Basic and Proficient levels increase
The NAEP Basic level denotes partial mastery of the knowledge and skills fundamental for proficient work at each grade. Seventy-seven percent of fourth-graders, 72 percent of eighth-graders, and 64 percent of twelfth-graders performed at or above the Basic level in civics in 2010. The percentages of students at or above Basic in 2010 were higher than in 2006 and 1998 at grade 4, but not significantly different from previous assessment years at grades 8 and 12.
The Proficient level represents solid academic performance to which all students at each grade assessed should aspire. Students reaching this level have demonstrated competency over challenging subject matter. Twenty-seven percent of fourth-graders, 22 percent of eighth-graders, and 24 percent of twelfth-graders performed at or above the Proficient level in civics in 2010. The percentages of students at or above Proficient in 2010 were higher than in 2006 and 1998 at grade 4, not significantly different from the percentages in the previous assessment years at grade 8, and lower than 2006 at grade 12.
No significant changes in percentages of students at Advanced
The Advanced level represents superior performance. Two percent of fourth-graders, 1 percent of eighth-graders, and 4 percent of twelfth-graders performed at the Advanced level in civics in 2010. There were no significant changes in the percentages of fourth-, eighth-, and twelfth-graders at Advanced in comparison to previous assessment years.
Examples of skills demonstrated by students performing at each achievement level
|
Hispanic students make gains from 1998 to 2010 at all three grades
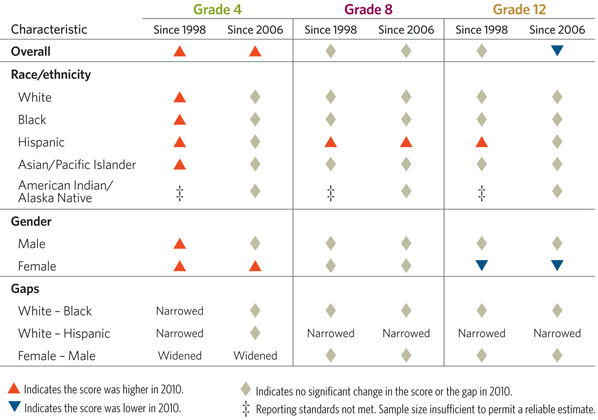
Average civics scores for Hispanic students were higher in 2010 than in 2006 at grade 8, and higher than in 1998 at all three grades. Gains for Hispanic students contributed to a narrowing of the White – Hispanic score gap in comparison to the gaps in earlier assessment years for grades 8 and 12. At grade 4, the White – Hispanic gap in 2010 was not significantly different from the gap in 2006 but narrowed in comparison to 1998.
Performance improves from 1998 to 2010 for most racial/ethnic groups at grade 4
Average scores were higher in 2010 than in 1998 for fourth-graders in all racial/ethnic groups with samples large enough to report results. Although not represented in the table below, the percentages of White, Black, Hispanic, and Asian/Pacific Islander students performing below the Basic level decreased from 1998 to 2010, and the percentages at Proficient increased.
Female students score higher than male students at grade 4
The average score for female fourth-graders increased since 2006, while there was no significant change in the score for male fourth-graders over the same period. In 2010, female students scored 7 points higher on average than male students at grade 4, which was larger than the 2-point score difference between the two groups in earlier assessment years.
The average score for female twelfth-graders was lower in 2010 than in 2006 and 1998, while there was no significant change in the score for male twelfth-graders in comparison to either year. There was no significant difference between the scores of female and male students in 2010 at grade 12 or grade 8.

Download the complete report in a PDF file for viewing and printing:
![]() The Nation's Report Card: Civics 2010 report PDF (6246K PDF)
The Nation's Report Card: Civics 2010 report PDF (6246K PDF)
NCES 2011-466 Ordering information
Suggested Citation
National Center for Education Statistics (2011). The Nation’s Report Card: Civics 2010 (NCES 2011–466). Institute of Education Sciences, U.S. Department of Education, Washington, D.C.
For more information, see the results of the 2010 Civics assessment on the Nation's Report Card website.
Last updated 29 April 2011 (RH)