- Surveys & Programs
- Data & Tools
- Fast Facts
- News & Events
- Publications & Products
- About Us
Who Attends Charter Schools?
While charter schools are similar to other public schools in many respects, they differ in several important ways, including the makeup of the student population and their location. For example, in comparison to other public schools, higher percentages of charter school fourth-grade students are Black or attend schools in central cities.
Grade 4: 2003
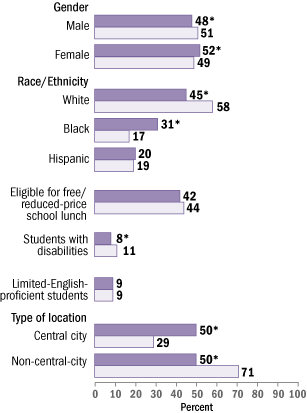
*Significantly different from other public schools.
Source: U.S. Department of Education, Institute of Education Sciences, National Center for Education Statistics, National Assessment of Educational Progress (NAEP), 2003 Mathematics Charter School Pilot Study.
| Percentage of students assessed in mathematics, by type of public school and student characteristics, grade 4: 2003 | |||
|---|---|---|---|
| Characteristic | Charter schools | Other public schools | |
|
| |||
| Gender | |||
| Male | 48 | * | 51 |
| Female | 52 | * | 49 |
| Race/ethnicity | |||
| White | 45 | * | 58 |
| Black | 31 | * | 17 |
| Hispanic | 20 | 19 | |
| Other1 | 4 | * | 6 |
|
| |||
| Eligible | 42 | 44 | |
| Not eligible | 48 | 52 | |
| Information not available | 10 | 4 | |
| Students with disabilities | |||
| Yes | 8 | * | 11 |
| No | 92 | * | 89 |
| Limited-English-proficient students | |||
| Yes | 9 | 9 | |
| No | 91 | 91 | |
| Type of location | |||
| Central city | 50 | * | 29 |
| Non-central-city2 | 50 | * | 71 |
|
| |||
| * Significantly different from other public schools. 1Other includes Asian/Pacific Islander students, American Indian/Alaska Native students, and students categorized in school records as another race or ethnicity. 2Non-central-city includes students attending schools in urban fringe/large town and rural/small town locations. NOTE: Detail may not sum to totals because of rounding. The results for students with disabilities and limited-English-proficient students are based on students who were assessed and cannot be generalized to the total population of such students, which also includes students who could not be assessed based on defined exclusion criteria. SOURCE: U.S. Department of Education, Institute of Education Sciences, National Center for Education Statistics, National Assessment of Educational Progress (NAEP), 2003 Mathematics Charter School Pilot Study. | |||
Go back to America's Charter Schools for more information.
Explore NAEP charter school performance results.
Last updated 07 July 2016 (DS)