- Surveys & Programs
- Data & Tools
- Fast Facts
- News & Events
- Publications & Products
- About Us
Table of Contents | Search Technical Documentation | References
NAEP Technical DocumentationExemplar Theoretical Item Response Function (IRF) for the Generalized Partial Credit Item Response Theory (IRT) Model
This figure contains a plot of the theoretical item response function (IRF) for a polytomous item. The item is a constructed-response item that has more than just correct and incorrect responses. It has three response categories (e.g., incorrect, partially correct, completely correct). In the plot, the horizontal axis represents the theta (![]() ) scale, while the vertical axis represents the probability of a correct response. The solid curves represent the theoretical IRF based on the item parameter estimates and the equation for the generalized partial credit IRT model.
) scale, while the vertical axis represents the probability of a correct response. The solid curves represent the theoretical IRF based on the item parameter estimates and the equation for the generalized partial credit IRT model.
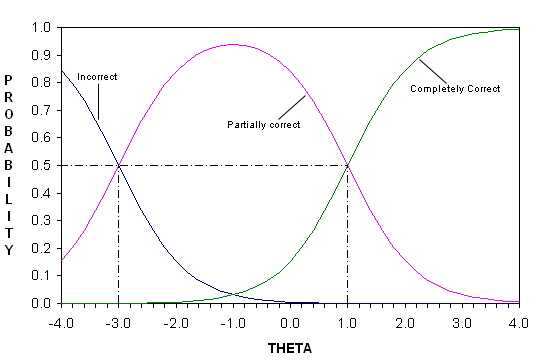 |
| SOURCE: U.S. Department of Education, Institute of Education Sciences, National Center for Education Statistics, National Assessment of Educational Progress (NAEP), 2000 and 2001 Assessment. |
For items of this type, students are unlikely to guess the correct answer, so students low on the scale are expected to have incorrect responses. Students higher on the ![]() scale are more likely to have a partially correct response to this item. And students highest on the
scale are more likely to have a partially correct response to this item. And students highest on the ![]() scale are most likely to have a completely correct response.
scale are most likely to have a completely correct response.
The b-parameter is the location parameter and it indicates the relative difficulty of the item. For this item b = -1.0. In general, items with b-parameter values greater than -1.0 are more difficult than this item; items with b-parameter values less than -1.0 are less difficult than this item.
For this item, d1 = 2.0 and d2 = -2.0. The place on the ![]() scale where students are equally likely to have responses in the incorrect and partially correct categories is -3.0 (b - d1 = –1.0 - 2.0); the place on the
scale where students are equally likely to have responses in the incorrect and partially correct categories is -3.0 (b - d1 = –1.0 - 2.0); the place on the ![]() scale where students are equally likely to have responses in the partially correct and completely correct categories is 1.0 (b - d2 = –1.0 + 2.0).
scale where students are equally likely to have responses in the partially correct and completely correct categories is 1.0 (b - d2 = –1.0 + 2.0).
The a-parameter indicates the maximum slope (steepness) of the curves. In the generalized partial credit model, the slopes for all the curves are of the same magnitude. This happens at the point where the curves for the incorrect and partially correct response categories cross and where the curves for the partially correct and completely correct response categories cross. The a-parameter value for this item is 1.0. Items with a-parameter values greater than 1.0 are more discriminating than this item; items with a-parameter values less than 1.0 are less discriminating. When an item is more discriminating the curves are steeper.
Last updated 12 August 2008 (RF)