- Surveys & Programs
- Data & Tools
- Fast Facts
- News & Events
- Publications & Products
- About Us
Table of Contents | Search Technical Documentation | References
NAEP Analysis and Scaling → Scale Linking and Transformation to the Reporting Metric → Linking Diagrams for NAEP Assessments → Linking Diagram for the Mathematics Samples at Each Grade, National Main and State Assessments: 2000
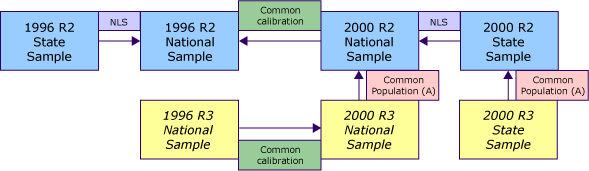 |
| NOTE: The arrow heads point to samples for which assessment results were already in the NAEP reporting metric. After state samples are deleted from this figure, it is appropriate for grade 12 as well as grades 4 and 8. R2 - Student sample in which accommodations were not permitted. R3 - Student sample in which accommodations were permitted. A - Refers to students in the sample who are not identified as SD or LEP. NLS - The National Linking Sample; the subset of the complete national sample that corresponds to the participating states, districts, and jurisdictions in the assessment year that were used in scaling. SOURCE: U.S. Department of Education, Institute of Education Sciences, National Center for Education Statistics, National Assessment of Educational Progress (NAEP), 2000 Mathematics Assessment. |
Last updated 17 July 2008 (KL)