- Surveys & Programs
- Data & Tools
- Fast Facts
- News & Events
- Publications & Products
- About Us
Table of Contents | Search Technical Documentation | References
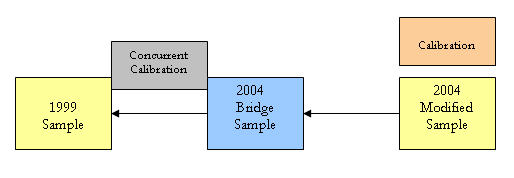
NAEP Analysis and Scaling → Scale Linking and Transformation to the Reporting Metric → Linking Diagrams for NAEP Assessments → Linking Diagram for the Mathematics Long-Term Trend Samples: 2004
 |
|
|
| NOTE: The arrowheads point to samples for which assessment results were already in the NAEP reporting metric in preparation for the 2004 mathematics long-term trend assessment. The bridging sample, which was comprised of linking and reconfigured samples, was used to convert the standard NAEP booklet design that had been used in the 1999 LTT assessment to the new design used for the 2004 long-term trend assessment. The bridging sample results were not reported. SOURCE: U.S. Department of Education, Institute of Education Sciences, National Center for Education Statistics, National Assessment of Educational Progress (NAEP), 2004 Mathematics Long-Term Trend Assessment. |
Last updated 27 April 2009 (JL)