- Surveys & Programs
- Data & Tools
- Fast Facts
- News & Events
- Publications & Products
- About Us
NAEP Technical Documentation NAEP 2009 Sample Design
In 2009, representative samples were drawn for the following operational and pilot assessments:
- national assessments of students in public and private schools in mathematics, reading, and science at grades 4, 8, and 12;
- state-by-state assessments and Trial Urban District Assessments (TUDA) in mathematics, reading, and science for public schools at grades 4 and 8;
- state-by-state assessments in mathematics and reading for public schools at grade 12 in 11 states;
- national assessments of students in public and private schools in science hands-on tasks (HOT) and science interactive computer testing (ICT) at grades 4, 8, and 12; and
- pilot tests in mathematics and reading in public and private schools at grades 4 and 8; and civics, geography, and U.S. history in grades 4, 8, and 12 public and private schools.
Representative samples were drawn for five separate components:
- mathematics, reading, and science assessments of fourth- and eighth-grade students in public schools;
- mathematics, reading, and science assessments of twelfth-grade students in public schools;
- mathematics, reading, and science assessments of fourth-, eighth- and twelfth-grade students in private schools;
- science HOT, science ICT, and pilot assessments of fourth-, eighth- and twelfth-grade students in public schools; and
- science HOT, science ICT, and pilot assessments of fourth-, eighth- and twelfth-grade students in private schools.
The national assessments were designed to achieve nationally representative samples of public and private school students in the fourth, eighth, and twelfth grades. Its target population included all students in public, private, Bureau of Indian Education (BIE), and Department of Defense Education Activity (DoDEA) schools, who were enrolled in fourth, eighth, and twelfth grades, respectively, at the time of assessment.
For fourth- and eighth-grade public schools, the NAEP state student samples and assessments constitute the NAEP national student samples and assessments. For twelfth-grade public schools, the national student samples consisted of two parts: an 11 state sample and a sample of the remaining jurisdictions. Nationally representative samples were drawn for the remaining populations of private school students in fourth, eighth, and twelfth grades. In state samples, a small portion of students received the science assessment in states not participating in science to supplement the national science sample.
The TUDA samples formed part of the corresponding state public school samples, and the state samples formed the public school grade 4 and 8 part of the national sample. For the grade 12 public school sample, there were no TUDA samples so the sample was strictly state-based.
The mathematics, reading, and science samples were based on a two-stage sample design:
- selection of schools within strata, and
- selection of students within schools.
The science HOT and science ICT samples were based on a three-stage sample design:
- selection of primary sampling units (PSUs),
- selection of schools within strata, and
- selection of students within schools.
In the three-stage design, schools were stratified and selected within the selected PSUs. The samples of schools were selected with probability proportional to a measure of size based on the estimated grade-specific enrollment in the schools for both designs.
The state assessments were designed to achieve representative samples of students in the fourth and eighth grades. Its target population included all students in each participating jurisdiction, which included states, District of Columbia, BIE, DoDEA, and school districts chosen for the TUDA study. Each sample was designed to produce aggregate estimates with reliable precision for all the participating jurisdictions, as well as estimates for various student subpopulations of interest.
All BIE schools were included in the state assessments. Also, public schools with high American Indian populations were oversampled in six states (Arizona, Minnesota, North Carolina, Oregon, Utah, and Washington). This was designed to enhance the reporting of results for American Indian students at the state level in those states with a sizable proportion of the nation's American Indian students for the National Indian Education Study (NIES), which was conducted in conjunction with NAEP.
State participation in the mathematics and reading assessments was effectively mandatory, whereas participation in the science study was optional, with four states declining to participate. By design, the District of Columbia and BIE schools participated in mathematics and reading only, as they each lacked the required number of students for the state science assessment.
The figure below illustrates the various sample types and subjects.
Components of the NAEP 2009 samples, by assessment subject, grade, and school type: 2009
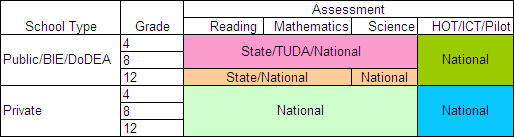
NOTE: View an accessible version of this figure.
SOURCE: U.S. Department of Education, Institute of Education Sciences, National Center for Education Statistics, National Assessment of Educational Progress (NAEP), 2009 Assessments.
Last updated 17 March 2016 (GF)