- Surveys & Programs
- Data & Tools
- Fast Facts
- News & Events
- Publications & Products
- About Us
NAEP Technical Documentation NAEP 2015 Sample Design
|
|
2015 State Assessment Sample Design
| ||
|
| |||
The sample design for NAEP 2015 included samples for various operational and special studies.
Representative samples were drawn for the following operational assessments:
- national assessments in mathematics, reading, science, and vocabulary in public and private schools at grades 4, 8, and 12;
- state-by-state assessments and Trial Urban District Assessments (TUDA) in mathematics and reading in public schools at grades 4 and 8; and
- state-by-state assessment in science in public schools at grades 4 and 8.
Representative samples were drawn for the following special studies:
- a special mathematics assessment in public schools in Puerto Rico at grades 4 and 8;
- a national special mathematics assessment in public and private schools at grades 4 and 8;
- The National Indian Education Study (NIES) at grades 4 and 8; and
- an evaluation study between the NAEP student survey questionnaire and the Early Childhood Longitudinal Study-Kindergarten Cohort parent questionnaire at grade 4.
The samples for the operational assessments were organized into three distinct groupings and sampled separately. The samples for the special studies were integrated into these various groupings:
- mathematics, reading, science, and vocabulary assessments in public schools at grades 4 and 8;
- mathematics, reading, science, and vocabulary assessments in public schools at grade 12; and
- mathematics, reading, science, and vocabulary assessments in private schools at grades 4, 8, and 12.
The national assessments were designed to achieve nationally representative samples of public and private school students in the fourth, eighth, and twelfth grades. Their target populations included all students in public, private, Bureau of Indian Education (BIE), and Department of Defense Education Activity (DoDEA) schools, who were enrolled in grades 4, 8, and 12 at the time of assessment.
For the fourth- and eighth-grade mathematics, reading, and science assessments in public schools, the NAEP state student samples and assessments constituted the NAEP national student samples and assessments. Nationally representative samples were drawn for vocabulary and for the remaining populations of private school students, DoDEA students, and BIE students in the fourth and eighth grades.
The TUDA samples formed part of the corresponding state public school samples, and the state samples formed the public school grades 4 and 8 part of the national sample.
At grade 12, a nationally representative sample for mathematics, reading, science, and vocabulary was drawn for the populations of public, private, BIE, and DoDEA schools.
The state assessments were designed to achieve representative samples of students in the respective grade. At grades 4 and 8, the target populations included all students in each participating jurisdiction, which included states, District of Columbia, BIE, DoDEA, and school districts chosen for the TUDA. For each grade and assessment subject, samples were designed to produce aggregate estimates with reliable precision for all the participating jurisdictions, as well as estimates for various student subpopulations of interest.
The figure below illustrates the various sample types and subjects.
Components of the NAEP samples, by assessment subject, grade, and school type: 2015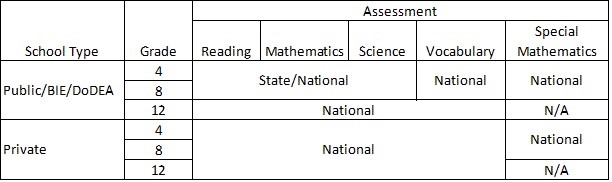
SOURCE: U.S. Department of Education, Institute of Education Sciences, National Center for Education Statistics, National Assessment of Educational Progress (NAEP), 2015 Assessments.
Last updated 26 January 2022 (SK)