- Surveys & Programs
- Data & Tools
- Fast Facts
- News & Events
- Publications & Products
- About Us
Table of Contents | Search Technical Documentation | References
NAEP Technical DocumentationLong-Term Trend School Sample Measures of Size
For 9-year-olds, the frame contained schools in the PSUs with a second, third, fourth, or fifth grade. Mij(2), Mij(3), Mij(4), and Mij(5) denote the estimated enrollments for four grades respectively within each school j within each PSU i, and Fi(2), Fi(3), Fi(4), and Fi(5) denote the global percentage of students who were 9 years old (birth months January 1994 through December 1994) within each grade, NAEP region, and within public and private schools separately. These values are shown in the table below for public and private schools respectively. Age Distribution Fractions for Nine and Thirteen-Year Olds describes how the NAEP sample design staff computed these percentages (as well as those for 13- and 17-year-old students given below). The totals are less than 100 percent as a small number of nine-year olds are distributed outside of the grade range second through fifth.
| School type | NAEP region | Fi(2) | Fi(3) | Fi(4) | Fi(5) | Total |
|---|---|---|---|---|---|---|
| Public schools | Northeast | 2.0 | 27.5 | 69.9 | 0.4 | 99.7 |
| Southeast | 6.3 | 41.4 | 51.4 | 0.3 | 99.5 | |
| Central | 2.8 | 42.5 | 54.3 | 0.2 | 99.8 | |
| West | 1.9 | 32.3 | 65.4 | 0.2 | 99.9 | |
| Private schools | Northeast | 0.9 | 24.0 | 73.3 | 1.7 | 99.9 |
| Southeast | 1.1 | 38.1 | 60.1 | 0.5 | 99.7 | |
| Central | 0.7 | 41.7 | 57.0 | 0.5 | 99.9 | |
| West | 0.7 | 32.1 | 66.0 | 1.0 | 99.9 | |
| SOURCE: U.S. Department of Education, Institute of Education Sciences, National Center for Education Statistics, National Assessment of Educational Progress (NAEP), 2004 Long-Term Trend Assessment. | ||||||
The measure of size for the 9-year-olds component of the long-term trend study for each school was computed as follows:

For 13-year-olds, the frame contained schools in the PSUs with a fifth, sixth, seventh, or eighth grade. Mij(6), Mij(7), Mij(8), and Mij(9) denote the estimated enrollments for the four grades respectively within each school j within each PSU i, and Gi(6), Gi(7), Gi(8), and Gi(9) denote the global percentage of students who were 13 years old (birth months January 1990 through December 1990) within each grade, NAEP region, and within public and private schools separately. These values are shown in the table below for public and private schools respectively. Age Distribution Fractions for Nine and Thirteen-Year Olds describes how sample design staff computed these percentages . The totals are less than 100 percent as a small number of 13-year-olds are distributed outside of the grade range 6 through 9.
| School type | NAEP region | Gi(6) | Gi(7) | Gi(8) | Gi(9) | Total |
|---|---|---|---|---|---|---|
| Public schools | Northeast | 2.6 | 28.2 | 68.3 | 0.8 | 99.8 |
| Southeast | 6.1 | 37.7 | 55.0 | 0.4 | 99.2 | |
| Central | 3.1 | 43.1 | 53.4 | 0.2 | 99.9 | |
| West | 2.5 | 33.3 | 63.5 | 0.4 | 99.8 | |
| Private schools | Northeast | 1.2 | 23.4 | 74.3 | 1.1 | 99.9 |
| Southeast | 1.5 | 37.2 | 60.4 | 0.6 | 99.8 | |
| Central | 1.4 | 38.5 | 59.6 | 0.4 | 99.9 | |
| West | 1.8 | 33.6 | 63.3 | 0.9 | 99.6 | |
| SOURCE: U.S. Department of Education, Institute of Education Sciences, National Center for Education Statistics, National Assessment of Educational Progress (NAEP), 2004 Long-Term Trend Assessment. | ||||||
The measure of size for the 13-year-olds component of the long-term trend study for each school was computed as follows:

For 17-year-olds, the frame contained schools in the PSUs with a ninth, tenth, eleventh, or twelfth grade. Mij(9), Mij(10), Mij(11), and Mij(12) denote the estimated enrollments for the four grades respectively within each school j within each PSU i, and Ji(9), Ji(10), Ji(11), and Ji(12) denote the global percentage of students who were 17 years old (birth months October 1986 through September 1987) within each grade and NAEP region. These values are shown in the table below for all schools, public and private, together (a breakout by public/private status was not done as for ages 9 and 13 because of the small percentage of private school students in the twelfth grade). Age Distribution Fractions for Age 17 describes how sample design staff computed these percentages . The totals are less than 100 percent as a small number of 17-year-olds are distributed outside of the grade range ninth through twelfth.
| School type and NAEP region | Ji(9) | Ji(10) | Ji(11) | Ji(12) | Total |
|---|---|---|---|---|---|
| Northeast | 3.9 | 22.6 | 65.4 | 8.0 | 100 |
| Southeast | 5.9 | 24.3 | 66.2 | 3.7 | 100 |
| Central | 3.7 | 30.6 | 63.7 | 2.0 | 100 |
| West | 5.4 | 23.1 | 64.7 | 6.7 | 100 |
| SOURCE: U.S. Department of Education, Institute of Education Sciences, National Center for Education Statistics, National Assessment of Educational Progress (NAEP), 2004 Long-Term Trend Assessment. | |||||
The measure of size for the 17-year-olds component of the long-term trend study for each school was computed as follows:

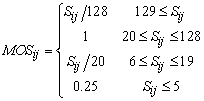
The within-school sample size for 9-year-olds and 13-year-olds for each school, yij, is as follows :
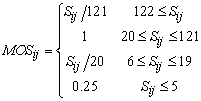
For 17-year-olds the within-school sample size is as follows:
The school measure of size for 9- and 13-year-olds is:

For 17-year-olds the school measure of size is:

The school probability of selection for all three ages is as follows:
PSCijis equal to 1, except for private schools identified in the area probability component of the Private School Survey (PSS). For these schools, PSCij is the reciprocal of the probability of selection into the PSS area probability component. Adding this component to the measure of size allows us to correctly represent the full universe of private schools in this area probability component. R is computed so that the expected yield within the sampled schools equals the overall target of sampled students in each age group. These targets and the calculated values for R are given in the table below.
| School type | Age sample | Student target | Computed factor R |
|---|---|---|---|
| Public | 9-year-old | 30,200 | 0.00822 |
| Private | 9-year-old | 7,600 | 0.02040 |
| Public | 13-year-old | 31,700 | 0.00872 |
| Private | 13-year-old | 8,000 | 0.02258 |
| Public | 17-year-old | 39,300 | 0.01216 |
| Private | 17-year-old | 10,200 | 0.03647 |
| SOURCE: U.S. Department of Education, Institute of Education Sciences, National Center for Education Statistics, National Assessment of Educational Progress (NAEP), 2004 Long-Term Trend Assessment. | |||
Last updated 22 October 2009 (GF)